Three Tools to Improve the Performance of Engineering Teams
I conducted a thought exercise to select a shortlist of metrics and tools suitable for an engineering team in an organization not yet heavily invested in data-based decision-making. I prioritized tools that could be implemented within the team itself to avoid the complexity of broader organizational changes. For instance, despite their significance, I excluded DORA metrics because most teams alone can only have a limited impact on them.
Finally, I selected tracking Code Review Time as a simple metric that can have a positive impact on multiple different areas; introducing Cumulative Flow Diagram for better workflow management; and running regular Team Health Checks to enhance overall team performance and morale. I'd also like to share my thought process and some details on these tools.
What are we looking at?
I began with a rough formulation of what a high-performing Engineering Team looks like, which led me to the following definition:
Capable individuals engaged to collaborate on delivering the right things at the right time in high quality.
I think it covers most aspects, or at least is good enough for this purpose. Every team is different: they work in different organizations, have different problems to solve, consist of differently skilled people, etc. But for the sake of the exercise, let’s stay with this hypothetical team.
Taking the apart high-performing statement from above, with highlights added…
“Capable individuals engaged to collaborate on delivering the right things at the right time in high quality.”
…I want to track and improve the following aspects (in no order of importance):
- Capable ⇒ Expertise: covering technical skills and experience.
- Engaged ⇒ Engagement: participation and motivation to work.
- Collaborate ⇒ Collaboration: working together as a team to achieve a common goal.
- The right things ⇒ Efficacy: working on the most impactful tasks.
- The right time ⇒ Predictability: a consistent schedule of reliable releases.
- High quality ⇒ Quality: the delivered work solves the specified problems, and is error-free, scalable, and easy to maintain.
Sounds good. Let’s consider the following three tools that can impact these areas.
1. Code Review Time
The simplest of the three, just measuring the time it takes for a code change request to be approved. Mean time is better than average if you want to remove the impact of extremities (sometimes you can’t avoid a huge changeset or asking multiple busy reviewers). Set up automatic weekly reports on trends and take actions to improve the data.
Approaches an Engineering Leader can take to push Code Review Time down:
- Mentor the team on the benefits of small, frequent code changes.
- Foster a culture where code reviews are considered a high-priority task, prioritizing unblocking others over writing new code.
- Train and educate team members on effective code review techniques. Show what a good Pull Request (or Merge Request) looks like, and similarly, use good code review feedback as examples to the team.
- Experiment with pair- and group-review processes.
- Align with the team on an ambitious code review time goal. Depending on the team size, code health and complexity, testing maturity, approval processes, etc. you should set a goal somewhere between a few hours and a couple of days max.
2. Cumulative Flow Diagram
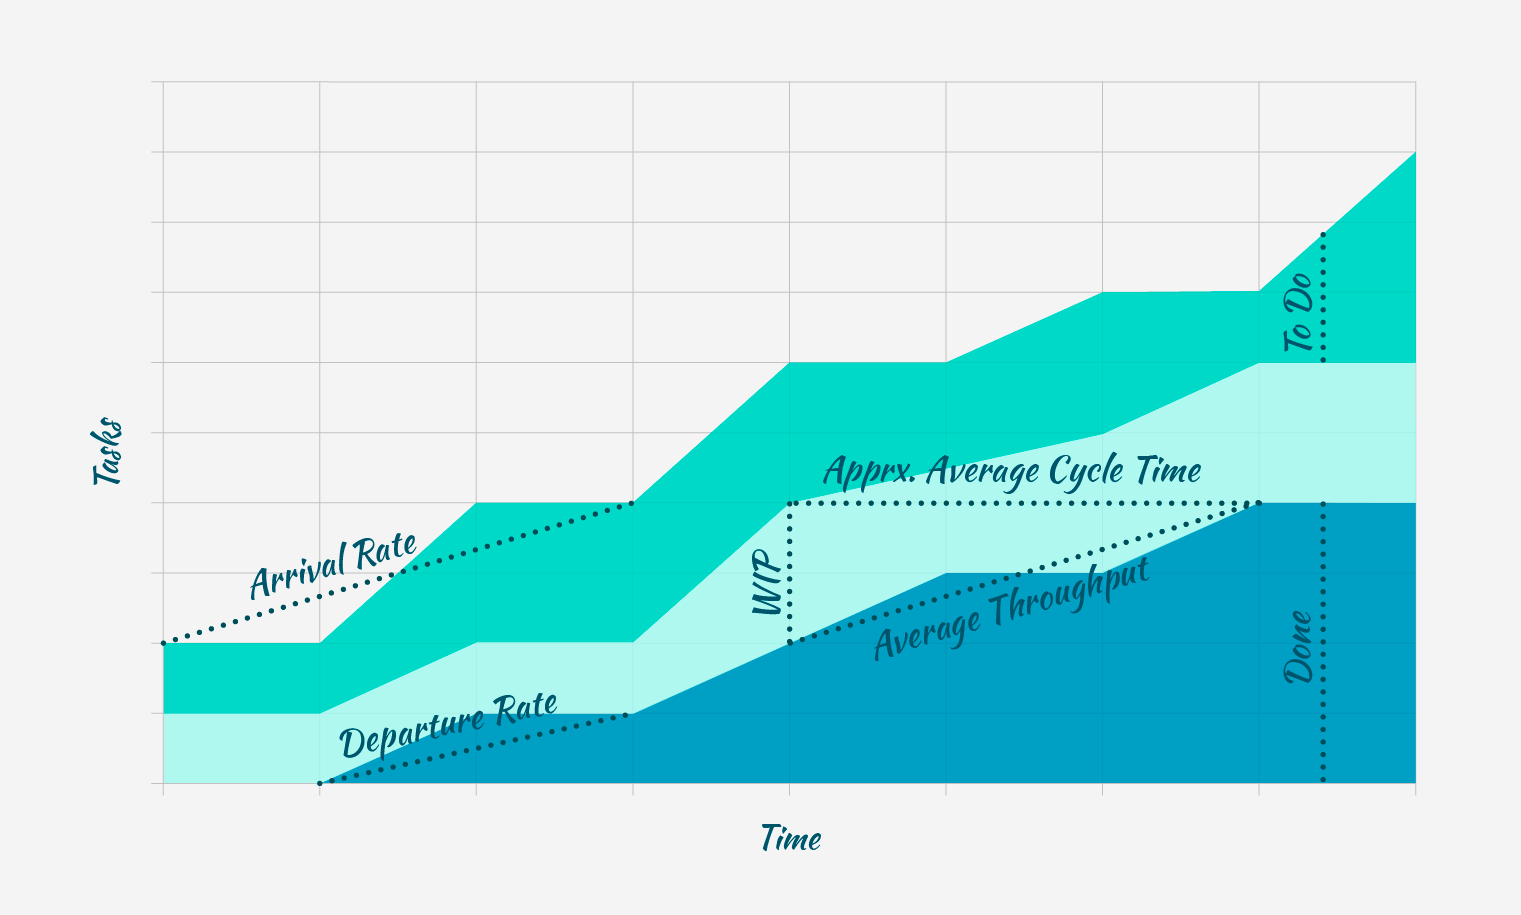
A Cumulative Flow Diagram is a visual tool for tracking and managing workflow, typically used by Scrum Masters, Agile Project Managers, and other team leaders to visualize and identify potential bottlenecks in their team’s workflow. This chart is commonly used in Kanban, but it can be utilized with any methodology. In its most bare-bones form, simply count the number of tasks your team has at the end of every week, and break it down into three statuses: To Do / Doing / Done. By visualizing this in time on a stacked area chart, you can calculate derived metrics like Average Cycle Time, Arrival/Departure rate, etc. (I won't go into the details of this tool here, my goal is to introduce it. For more in-depth understanding, there are great resources available on the web.)
You can get more granular by breaking down To Do (to confirmed and unconfirmed), all the phases of software development in Doing (eg: adding testing, deployment, etc.), separating issue times, and getting dedicated statistics like Bug Resolution Time, etc. But to start with, this simple setup should be enough to keep a finger on the pulse of your team’s work performance.
Things you can look at:
- Size of Work in Progress. If it’s going up, what are the causes? Are you blocked and starting new things before shipping what’s in progress? Do you need to re-prioritize and answer to unplanned urgencies frequently? Consider implementing hard WIP limits in planning. Similarly, if you see a good trend of WIP going down without team members being absent, look into what’s going well so you can double down on it. Just ensure your Departure Rate points upward, and your team is not working on a single issue for weeks.
- Departure Rate in relation to Arrival Rate. Ideally, these are close to parallel, both pointing upwards. This means that your team is getting stuff done in a predictable, reliable cadence. If not, reasons are often at the grooming/planning phase. Are you refining properly, slicing big tickets to multiple small tasks? Are you saying “no” to non-important requests and ideas frequently enough?
- Repetitive flat lines with big jumps in between (a staircase pattern) could mean bottlenecks in your workflows. If Done is growing in big increments, you need to look into improving your code approval, testing, and deployment processes to ensure a smooth, continuous delivery.
This was just an intro to CFDs for teams who don’t use this yet. Avoid the temptation of introducing a complex system, start simple, and iterate based on how the tool works for your needs.
3. Team Health Check
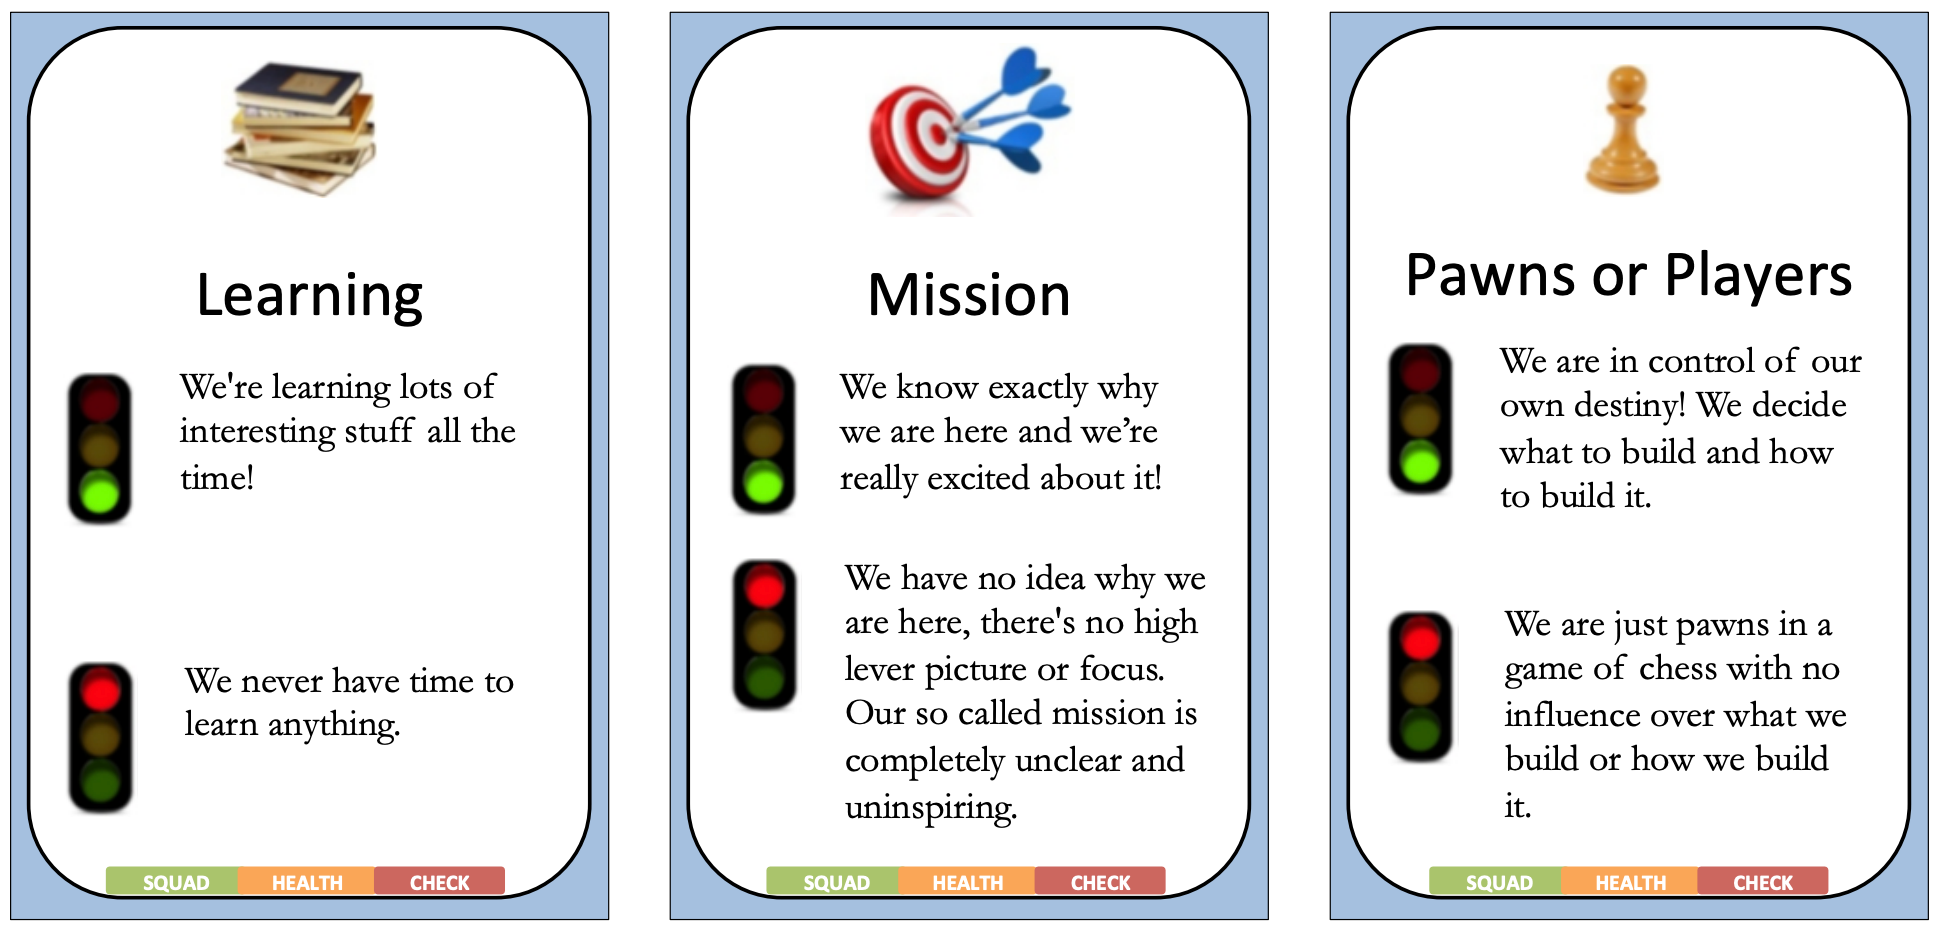
This is a regular exercise to assess the team's performance and morale. Spotify popularized this tool almost a decade ago. It involves team members answering questions related to the past period around topics like engagement, efficiency, collaboration, etc. The scoring is a simply Red/Amber/Green status, with additional trend signals. The results are then discussed as a team and areas for improvement and action items are identified. The findings can directly impact the areas surveyed, but I find the indirect positive impact of care and attention to team health even bigger. Showing accountability and taking action increases engagement. (Caveat: if there are no follow-ups and actions just hang in the air, the decrease in engagement can be much bigger!)
Add this exercise to your regular retrospective meeting — start one if you don’t have it yet, once a month or so should be a good cadence. Beginning with the exact process and topics from the Spotify model should be a good start, but feel free to adapt based on team feedback and how valuable the findings are for you as a leader.
The results of this health check become even more valuable once you have some historical data, and you can discover trends or compare your team to others in the organization (carefully, be mindful of inherent differences).
Conclusion
If you’re leading an engineering team, consider introducing Code Review Time tracking to increase the development experience and quality, the Cumulative Flow Diagram to find bottlenecks and suboptimal processes, and a regular Team Health Check to identify further areas for improvement.
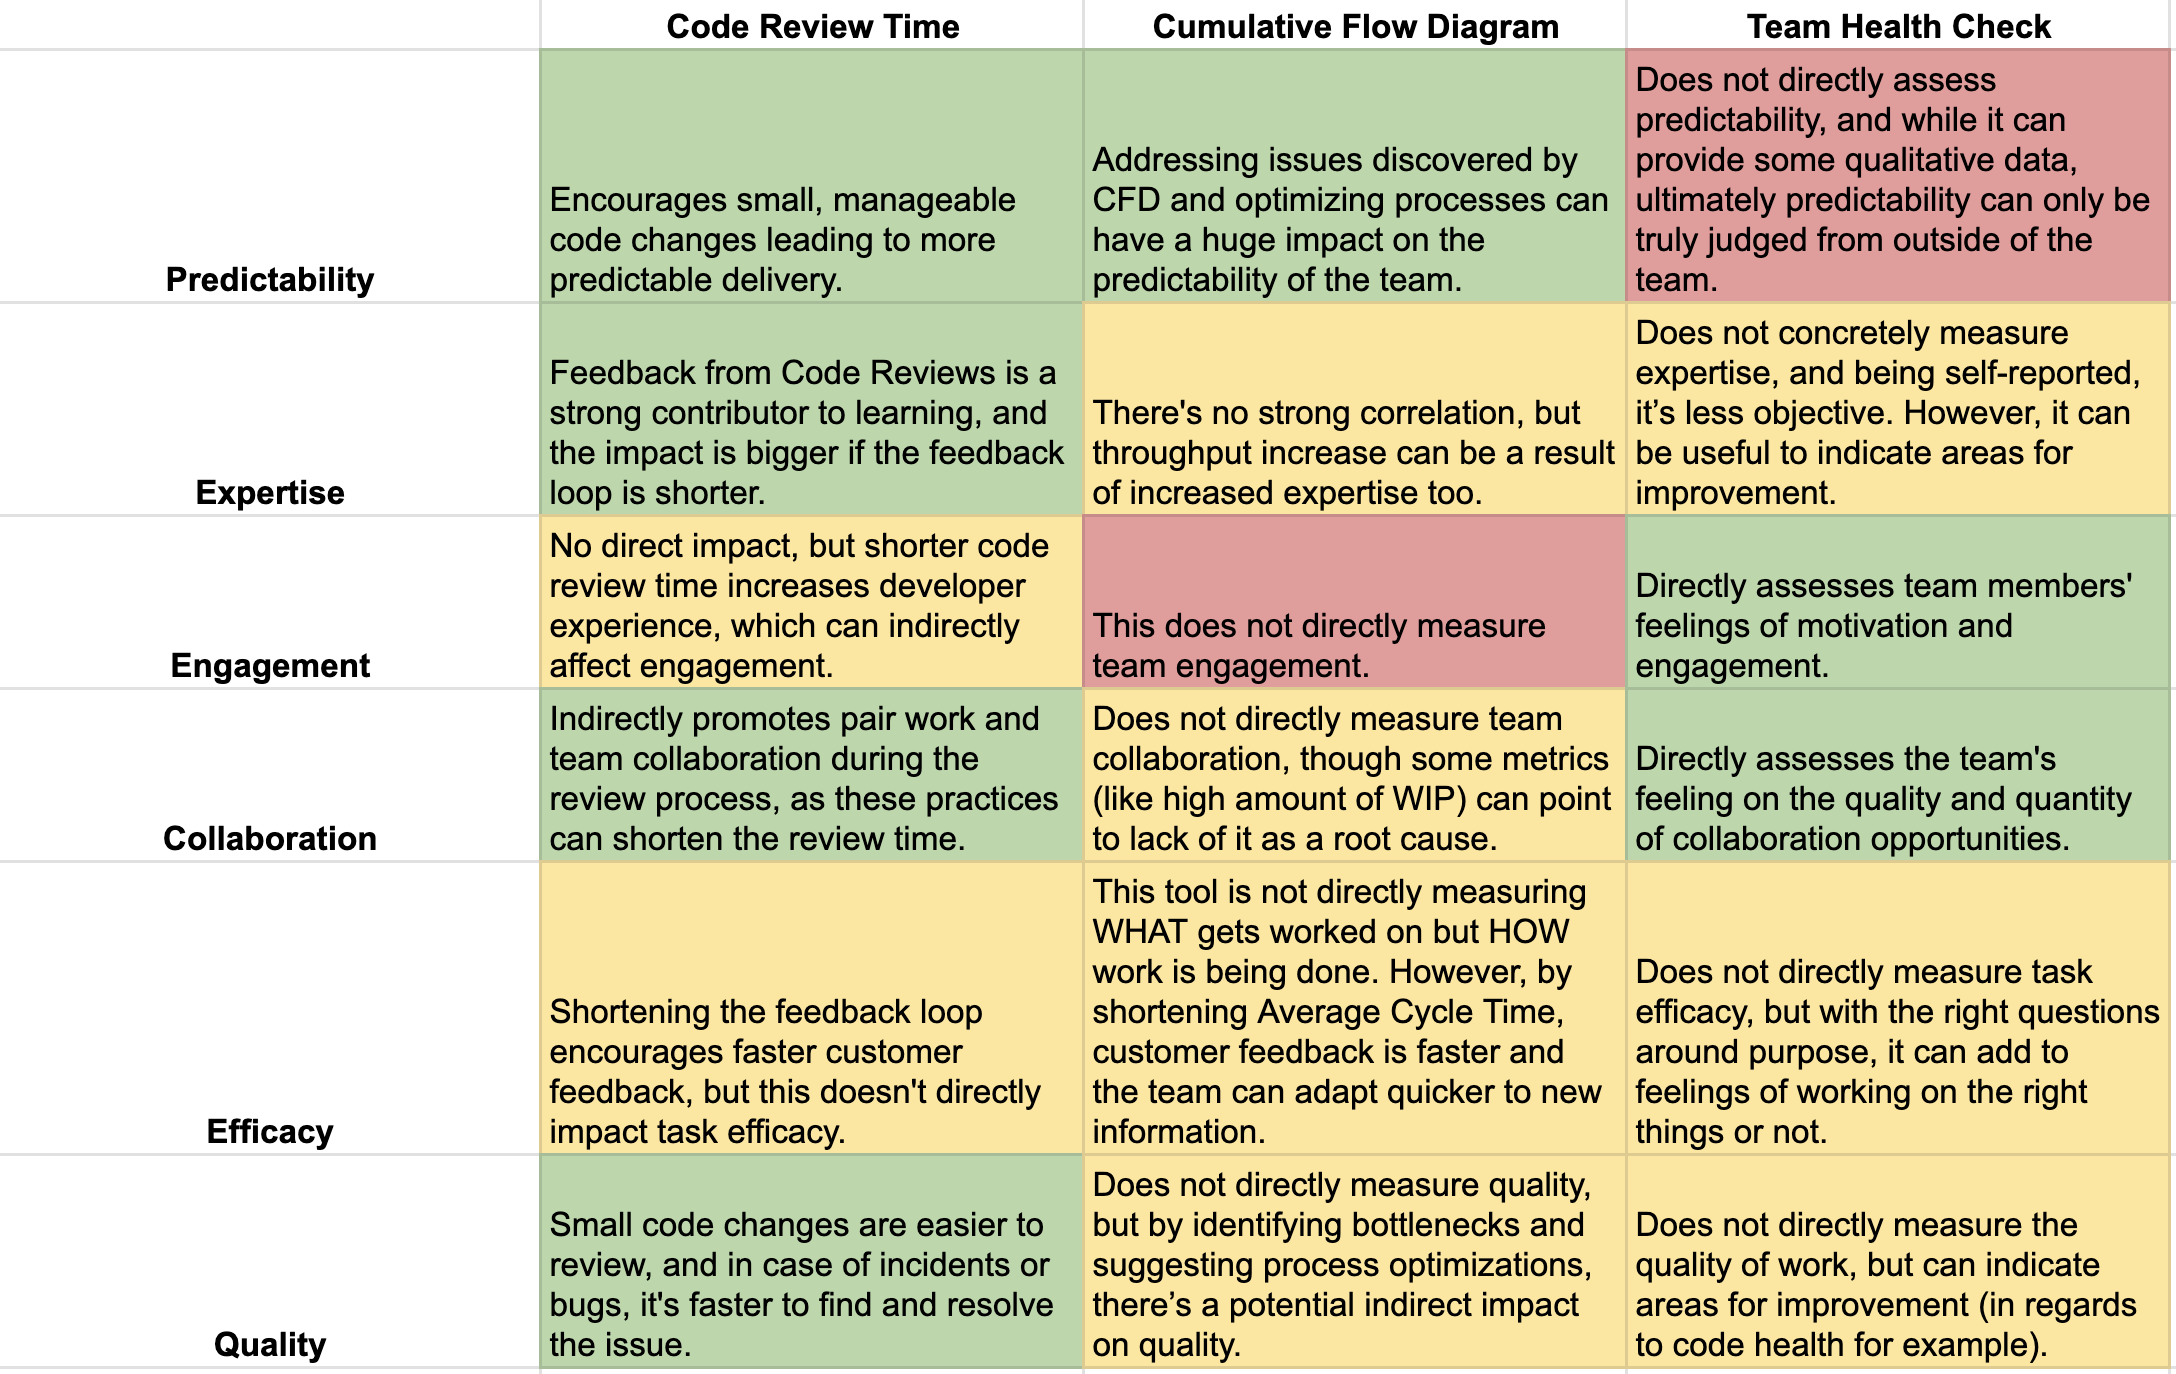
To validate these ideas, and help choose which tool to introduce first depending on what area you want to see improvements on, I summarized how each one of them can impact the respective aspects from my definition of a high-performing Engineering Team (“Capable individuals engaged to collaborate on delivering the right things at the right time in high quality.”) in a table:
Notes:
- You can see why I selected the misleadingly simple metric of Code Review Time, its impact is visible across many areas.
- The Cumulative Flow Diagram and Team Health Checks, while limited and focused on specific areas, can significantly influence those few.
Do you have a favorite simple metric or tool I missed? Did you have experience with one of the above? Add your feedback to the comments, or drop me a message at [email protected].
On this blog, I’m writing about Engineering Leadership challenges based on the learnings from 25 years in the tech industry. If you found this content useful, sign up to receive an email when I publish something similar.